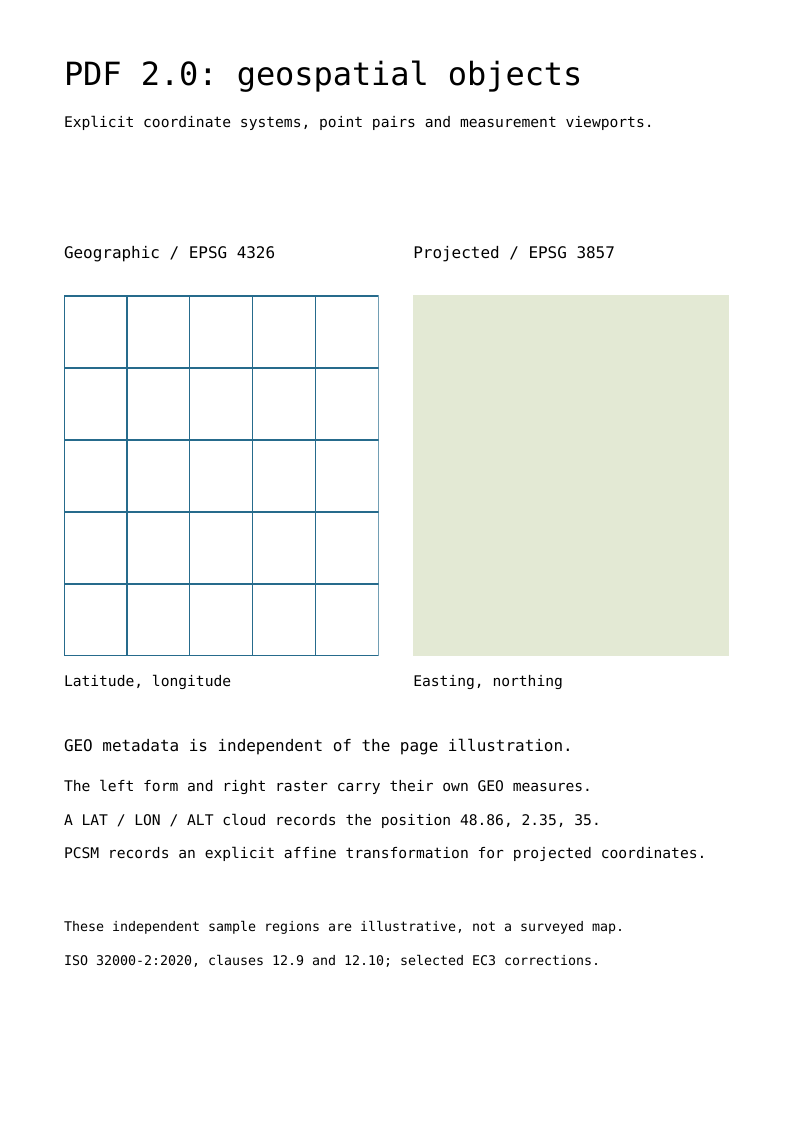
The complete script draws two illustrative panels and attaches geospatial measurement data to the page, a Form XObject and an image. One region declares a geographic reference system; the other declares a projected system. They are independent sample regions, not a conversion of the same surveyed map.
Drawing a grid does not create geographic semantics. The script separately constructs the coordinate systems, control-point pairs, measurement viewports, preferred units and point cloud that describe the PDF objects.
Run the example
From a core 0.7.1 checkout:
php examples/pdf20-geospatial.php geospatial.pdf
The example supplies Courier through explicit metrics: FirstChar/LastChar, ASCII widths and a FontDescriptor. PDF 2.0 no longer permits omitting these entries for the fourteen standard fonts. This construction does not embed a font program; profiles requiring embedding need an explicitly embedded font.
The example uses native PDF objects only. It needs no external image converter, font converter, GIS database or projection executable. A viewer may display the page without offering geographic measurement tools; the preview still shows the actual drawing.
Declare coordinate systems explicitly
$geographic = new G\GeographicCoordinateSystem(new G\EpsgCode(4326));
$projected = new G\ProjectedCoordinateSystem(new G\EpsgCode(3857));
Here G aliases PDF\Document\Geospatial in the script. A GeographicCoordinateSystem accepts exactly one EPSG code or WKT string. A ProjectedCoordinateSystem requires at least one of them. WKT is supplied through AsciiString; the library does not fetch a registry, parse an entire WKT grammar or infer a projection from the page drawing.
Changing an identifier does not recalculate the control points. Supply coordinates that actually belong to the chosen system. GeographicPosition stores latitude before longitude; ProjectedPosition stores easting before northing. Values must be finite, and latitude is bounded to −90 through 90 degrees. No arbitrary longitude branch is imposed.
Keep local and world points synchronized
GeospatialControlPoint pairs a LocalPosition with a world position. GeospatialControlPoints derives /LPTS and /GPTS from those same pairs, preventing different array lengths or mixed dimensions and coordinate kinds.
$point = new G\GeospatialControlPoint(
    new G\LocalPosition(new N(0), new N(0)),
    new G\GeographicPosition(new N(48.85), new N(2.34)),
);
The example uses four control points per region. Local two-dimensional coordinates lie in the object's unit square. GeospatialBounds supplies the normalized neatline polygon; it does not replace the viewport's rectangle in page coordinates. The 3D variant uses triples in the permitted 3D/RichMedia contexts, with separate validation rather than silently treating every measure as three-dimensional.
Give each measurement its actual owner
GeospatialMeasure writes /Type /Measure, /Subtype /GEO, its coordinate system and paired arrays. A Viewport supplies the page-space /BBox, an optional name and that measure; Viewports provides the page's /VP array.
For overlapping viewports, Viewports::forPoint() selects the last one containing the measurement's first point. Viewport::local() converts a page point to normalized local coordinates. Neither operation performs a geographic projection.
The left panel paints a Form XObject with its own /Measure and /PtData; the right paints a one-pixel image with its own /Measure. Their painting matrices position the illustration independently of their geospatial metadata. Effective-graph checks also cover generic dictionaries and incremental replacements, so manually adding entries does not bypass the context or version rules.
Add display units, a matrix and point data
PreferredDisplayUnits receives a linear, area and angular enum in that order. The example chooses metres, square metres and degrees. These preferences describe a reader's measurement display, not the units of the page's graphics operators.
ProjectedCoordinateSystemMatrix contains exactly twelve numeric coefficients. It applies the row vector [x y z 1] with an implicit final column [0 0 0 1], and takes precedence over GPTS in a projected system. Its transform() executes that affine calculation; it does not convert one map projection into another.
PointDataNames names the point-cloud columns; each PointData tuple has exactly that width. The sample LAT/LON/ALT tuple contains 48.86, 2.35 and 35. PointDataCollection associates such clouds with a viewport. Column data and drawing operators remain independent objects.
Check the serialized relationships
tools/validate_pdf20_geospatial.py independently reads emitted GCS/GPTS/LPTS, Bounds, PDU, PCSM, viewports, Form/image owners and point clouds using pypdf and qpdf. It checks initial, incremental and linearized output in all three cross-reference formats, including historical/fallback prefixes.
python tools/validate_pdf20_geospatial.py \
  --php php --qpdf qpdf --work-dir /tmp/pdf20-geospatial
To explore the model, move a viewport, change its unit preferences or add another paired point. Keep the tuples synchronized and choose the coordinate kind explicitly. An independent GIS tool is still needed to establish the correctness of real survey data, WKT meaning or a projection conversion.
References
ISO 32000-2:2020 clauses 12.9 and 12.10, tables 265–272, physical pages 611–622, describe these objects. The retained original includes EC3 annotations. The native profile explicitly records issue 358 as Completed and issues 533, 534 and 284 as Accepted; their distinct approval authorities remain visible in the catalogue.
Tutorial path · Bundle guide · Coverage
View the PDF result
This file was generated with the code in this documentation. All pages appear below; open the PDF to use its links and bookmarks.
Use the browser PDF viewer
This viewer depends on your browser. If the document does not appear, use “Open the PDF” or “Download”.
Complete source code
Code from roukmoute/pdf · View the source at the documented commit ↗
Read the commented script: pdf20-geospatial.php
<?php

declare(strict_types=1);

use PDF\Document\Geospatial as G;
use PDF\Document\Images\DeviceColorSpace;
use PDF\Document\Images\ImageDimensions;
use PDF\Document\Images\ImageSamples;
use PDF\Document\Images\SampleLayout;
use PDF\Document\ResourceDictionary;
use PDF\Document\Resources\Font;
use PDF\Document\Resources\XObject;
use PDF\FileStructure;
use PDF\Graphics\CoordinateSystems\Matrix;
use PDF\Graphics\CoordinateSystems\Point;
use PDF\Graphics\XObjects\FormXObject;
use PDF\Graphics\XObjects\ImageOptions;
use PDF\Graphics\XObjects\ImageXObject;
use PDF\Syntax\ContentStreamsResources\ContentStreams;
use PDF\Syntax\ContentStreamsResources\Operators as Op;
use PDF\Syntax\DataStructure\Rectangle;
use PDF\Syntax\DataStructure\TextString;
use PDF\Syntax\DocumentStructure\DocumentCatalog;
use PDF\Syntax\DocumentStructure\PageTree\PageObject;
use PDF\Syntax\DocumentStructure\PageTree\PageTreeNode;
use PDF\Syntax\FileStructure\FileBody;
use PDF\Syntax\FileStructure\FileHeader;
use PDF\Syntax\Object\ArrayType;
use PDF\Syntax\Object\DictionaryObject\Entry;
use PDF\Syntax\Object\DictionaryType;
use PDF\Syntax\Object\IndirectReference;
use PDF\Syntax\Object\NameType;
use PDF\Syntax\Object\NumericType as N;
use PDF\Syntax\Object\StreamObject;
use PDF\Syntax\Object\StringObject\LiteralString;

require dirname(__DIR__) . '/vendor/autoload.php';

// 1. Declare the reference system. The core stores EPSG/WKT explicitly; it does
// not download a registry or silently run a geographic projection engine.
$geographic = new G\GeographicCoordinateSystem(new G\EpsgCode(4326));
$projected = new G\ProjectedCoordinateSystem(new G\EpsgCode(3857));
$geographicPoints = [];
$projectedPoints = [];
foreach ([[0, 0, 48.85, 2.34, 1000, 2000], [1, 0, 48.85, 2.36, 2000, 2000], [1, 1, 48.87, 2.36, 2000, 3000], [0, 1, 48.87, 2.34, 1000, 3000]] as [$x, $y, $latitude, $longitude, $easting, $northing]) {
    // GPTS latitude precedes longitude; projected GPTS uses easting/northing.
    $local = new G\LocalPosition(new N($x), new N($y));
    $geographicPoints[] = new G\GeospatialControlPoint($local, new G\GeographicPosition(new N($latitude), new N($longitude)));
    $projectedPoints[] = new G\GeospatialControlPoint($local, new G\ProjectedPosition(new N($easting), new N($northing)));
}
$bounds = new G\GeospatialBounds(new Point(new N(0), new N(0)), new Point(new N(0), new N(1)), new Point(new N(1), new N(1)), new Point(new N(1), new N(0)));
$units = new G\PreferredDisplayUnits(G\LinearDisplayUnit::Metre, G\AreaDisplayUnit::SquareMetre, G\AngularDisplayUnit::Degree);
$geoMeasure = new G\GeospatialMeasure($geographic, new G\GeospatialControlPoints(...$geographicPoints), $bounds, displayUnits: $units);
// PCSM has twelve row-order coefficients, with [0 0 0 1] as its implicit final
// column. It takes priority over GPTS for the projected coordinate system.
$pcsm = new G\ProjectedCoordinateSystemMatrix(...array_map(static fn (int $value): N => new N($value), [1000,0,0,0,1000,0,0,0,1,1000,2000,0]));
$projectedMeasure = new G\GeospatialMeasure($projected, new G\GeospatialControlPoints(...$projectedPoints), $bounds, displayUnits: $units, matrix: $pcsm);

// 2. A point cloud retains its own column names and unordered tuples. These
// illustrative positions are data, independently of how the page is drawn.
$cloud = new G\PointData(new G\PointDataNames(new NameType('LAT'), new NameType('LON'), new NameType('ALT')), new ArrayType(new N(48.86), new N(2.35), new N(35)));
$clouds = new G\PointDataCollection($cloud);
$left = new Rectangle(new N(48), new N(350), new N(284), new N(620));
$right = new Rectangle(new N(310), new N(350), new N(546), new N(620));
$viewports = new G\Viewports(new G\Viewport($left, $geoMeasure, new TextString('Geographic illustration'), $clouds), new G\Viewport($right, $projectedMeasure, new TextString('Projected illustration')));

// 3. GEO measures also belong directly to form and image XObjects. Their LPTS
// use the object's unit square, independently of the page's drawing matrix.
$grid = [new Op\SetStrokingRGBColor(new N(0.15), new N(0.42), new N(0.55)), new Op\SetLineWidth(new N(0.004)), new Op\AppendRectangle(new N(0), new N(0), new N(1), new N(1)), new Op\StrokePath()];
foreach ([0.2,0.4,0.6,0.8] as $position) {
    array_push($grid, new Op\MoveTo(new N($position), new N(0)), new Op\LineTo(new N($position), new N(1)), new Op\MoveTo(new N(0), new N($position)), new Op\LineTo(new N(1), new N($position)), new Op\StrokePath());
}
$form = new FormXObject(new ContentStreams(...$grid), new Rectangle(new N(0), new N(0), new N(1), new N(1)), new ResourceDictionary(), extensions: [new Entry(new NameType('Measure'), $geoMeasure), new Entry(new NameType('PtData'), $cloud)]);
$image = new ImageXObject(new ImageSamples(new ImageDimensions(1, 1), new SampleLayout(DeviceColorSpace::RGB), "\xe3\xe9\xd4"), options: new ImageOptions(extensions: [new Entry(new NameType('Measure'), $projectedMeasure)]));
// PDF 2.0 requires explicit metrics and a descriptor even for standard fonts.
$font = require __DIR__ . '/fixtures/pdf20-courier-font.php';
$resources = new ResourceDictionary(new Font(new DictionaryType(new Entry(new NameType('F1'), new IndirectReference($font)))), new XObject(new DictionaryType(new Entry(new NameType('Grid'), new IndirectReference($form)), new Entry(new NameType('Raster'), new IndirectReference($image)))));
$operators = [];
foreach ([['PDF 2.0: geospatial objects',24,48,778], ['Explicit coordinate systems, point pairs and measurement viewports.',11,48,746], ['Geographic / EPSG 4326',12,48,648], ['Projected / EPSG 3857',12,310,648], ['Latitude, longitude',11,48,327], ['Easting, northing',11,310,327], ['GEO metadata is independent of the page illustration.',12,48,278], ['The left form and right raster carry their own GEO measures.',11,48,248], ['A LAT / LON / ALT cloud records the position 48.86, 2.35, 35.',11,48,223], ['PCSM records an explicit affine transformation for projected coordinates.',11,48,198], ['These independent sample regions are illustrative, not a surveyed map.',10,48,143], ['ISO 32000-2:2020, clauses 12.9 and 12.10; selected EC3 corrections.',10,48,118]] as [$text, $size, $x, $y]) {
    array_push($operators, new Op\BeginTextObject(), new Op\SetTextFontAndSize(new NameType('F1'), new N($size)), new Op\MoveTextPosition(new N($x), new N($y)), new Op\ShowText(new LiteralString($text)), new Op\EndTextObject());
}
array_push($operators, new Op\SaveGraphicsState(), new Op\ConcatenateMatrix(new Matrix(new N(236), new N(0), new N(0), new N(270), new N(48), new N(350))), new Op\InvokeXObject(new NameType('Grid')), new Op\RestoreGraphicsState(), new Op\SaveGraphicsState(), new Op\ConcatenateMatrix(new Matrix(new N(236), new N(0), new N(0), new N(270), new N(310), new N(350))), new Op\InvokeXObject(new NameType('Raster')), new Op\RestoreGraphicsState());
$page = new PageObject(new Rectangle(new N(0), new N(0), new N(595), new N(842)), $resources, new StreamObject(new ContentStreams(...$operators)), new Entry(new NameType('VP'), $viewports));
$catalog = new DocumentCatalog((new PageTreeNode())->addKid($page));
$file = new FileStructure(new FileHeader('2.0'), new FileBody($catalog));
$path = $argv[1] ?? __DIR__ . '/pdf20-geospatial.pdf';
$file->writeTo($path);
echo 'PDF written to ' . $path . PHP_EOL;