Tutorial index · Previous: pages and text · Next: document outline
This lesson draws rectangles, a Bézier curve and a dashed segment. It then applies a translation and rotation to the same local rectangle. The complete script is graphics.php.
Run the example
Use PHP 8.3 or later and the dependencies installed by composer install. Document assembly follows the first tutorial. From the root of a core checkout:
php examples/graphics.php graphics.pdf
The first argument names the output. Without an argument, the file is examples/graphics.pdf. Its parent directory must already exist.
What you get
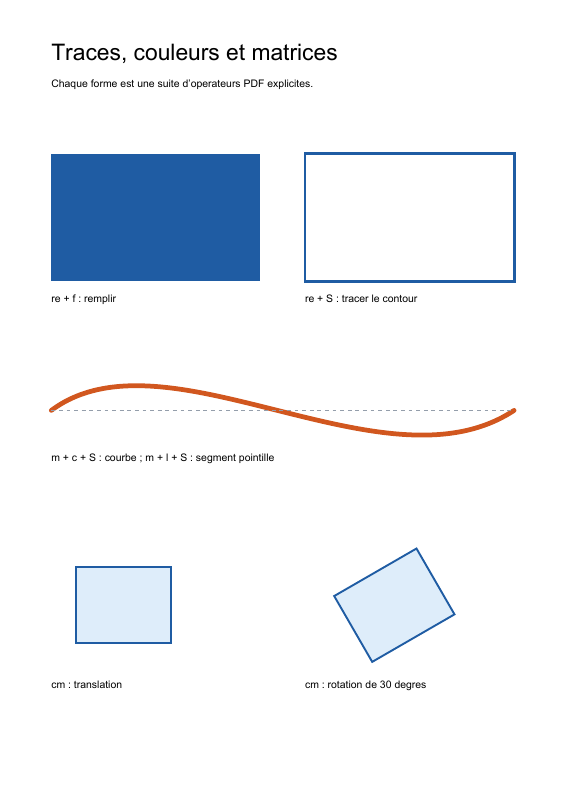
An A4 page with two blue rectangles, one filled and one stroked; an orange curve and its dashed chord; and two light-blue rectangles at the bottom, one rotated by 30 degrees. Labels remain black and horizontal.
1. Construct a path, then paint it
A path begins with a current point or a rectangle. Construction operators add its geometry; a painting operator then determines its rendering and ends the path.
| Object | Operator | Function |
|---|---|---|
AppendRectangle |
re |
Add a rectangle with x, y, width and height. |
MoveTo |
m |
Start a subpath at a point. |
LineTo |
l |
Add a segment from the current point. |
CurveTo |
c |
Add a curve with two control points and an end point. |
FillPathNonzero |
f |
Fill using the nonzero winding rule. |
StrokePath |
S |
Stroke the outline. |
FillAndStrokePathNonzero |
B |
Fill and stroke the outline. |
The first rectangle combines re with f, the second re with S. The bottom rectangle uses B. The curve starts at (54, 410), uses control points (175, 500) and (405, 320), and ends at (541, 410). Control points guide the curve without necessarily being points it passes through.
After f, S or B, the path is finished. To paint the same shape again, reconstruct it. The ContentStreams validator also rejects a color change or Q inside an unfinished path: settings precede geometry, then painting finishes it.
Reference: ISO 32000-1, 8.5.2–8.5.3 for path construction and painting.
2. Set two independent colors
SetNonstrokingRGBColor (rg) selects the color used for fills and for text in its default rendering mode. SetStrokingRGBColor (RG) selects the outline color. PDF operators are case-sensitive.
The three DeviceRGB components range from 0 to 1. SetLineWidth (w) sets the outline width. SetLineCapStyle(LineCapStyle::Round) (J) rounds the curve's ends. SetLineDashPattern (d) receives a LineDashPattern: [4 4] alternates four painted units with four empty units, starting with phase zero.
DeviceRGB colors suit this demonstration; their exact rendering depends on the reader and device. Color-managed output needs an appropriate color space, such as ICCBased, and explicit resources.
Reference: 8.4.3–8.4.4 for graphics-state parameters, 8.6.4.3 and 8.6.8 for DeviceRGB and color operators.
3. Isolate drawing with q and Q
SaveGraphicsState (q) pushes the current graphics state. RestoreGraphicsState (Q) restores the saved transformation matrix, colors, line width and other parameters. Each shape in the script is enclosed by this pair.
This explains why dashes do not affect subsequent rectangles and why their fill colors do not color the labels. It also protects text from the rotation applied to the last shape.
The current path's geometry is not part of the saved state. Q therefore does not end or cancel a path. The script paints each path before restoring the state, and balances all q/Q pairs.
Reference: 8.4.2 and 8.4.4.
4. Draw in a local coordinate system
ConcatenateMatrix (cm) receives a Matrix of six NumericType values: [a b c d e f]. For a local point (x, y), this example's transformation gives:
x' = a × x + c × y + e
y' = b × x + d × y + f
Here the page uses normal coordinates, with one unit equal to 1/72 inch and the origin at the lower left. The local rectangle is centered at (0, 0) and measures 100 × 80 units; its construction therefore begins at (-50, -40).
[1 0 0 1 130 205]places its center at(130, 205)without rotation.[0.8660254 0.5 -0.5 0.8660254 415 205]rotates it by 30 degrees and places its center at(415, 205). The values are roundedcos(30°)andsin(30°).
cm concatenates its matrix with the current matrix. The result depends on the existing state, and the order of multiple transformations matters. Each example starts again from the page state thanks to q and Q. Rotation does not modify the page's /Rotate: it transforms only the drawing in that block.
Reference: 8.3.2–8.3.3 for coordinate systems and matrices, 8.4.4 for cm.
Try it
- Replace
StrokePathwithFillAndStrokePathNonzeroto add a fill to a rectangle. - Change the curve's two control points while keeping its start and end points.
- Use
[2 0 0 2 e f]in an isolated block: the rectangle's size and outline width are transformed together. - Add a second
q/Qpair inside a block to experiment with nested states.
Positioning and margins are explicit. A path can extend beyond the page if its coordinates or transformation place it outside the paper; inspect the PDF after changing matrices.
Tutorial index · Previous: pages and text · Next: document outline
View the PDF result
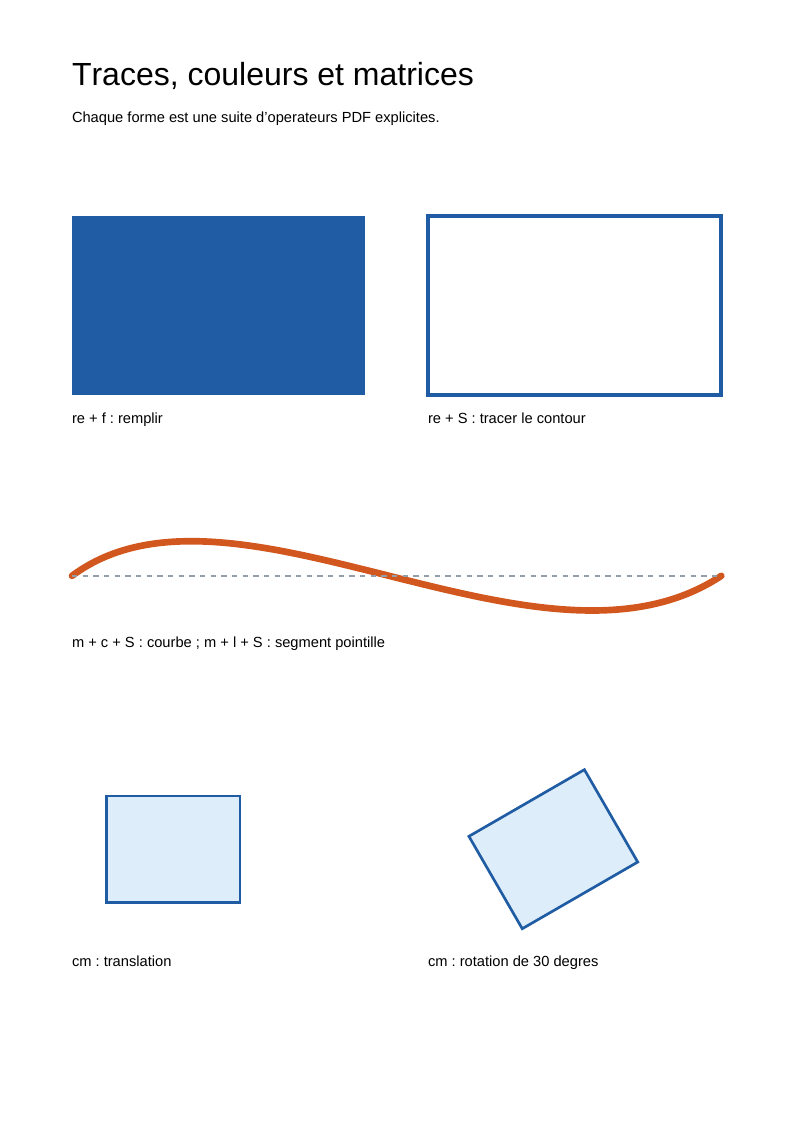
This file was generated with the code in this documentation. All pages appear below; open the PDF to use its links and bookmarks.
Use the browser PDF viewer
This viewer depends on your browser. If the document does not appear, use “Open the PDF” or “Download”.
Complete source code
Code from roukmoute/pdf · View the source at the documented commit ↗
Read the commented script: graphics.php
<?php

declare(strict_types=1);

use PDF\Document\DocumentInformation;
use PDF\Document\Fonts\StandardFont;
use PDF\Document\Fonts\Type1Font;
use PDF\Document\Information\Title;
use PDF\Document\ResourceDictionary;
use PDF\Document\Resources\Font;
use PDF\FileStructure;
use PDF\Graphics\CoordinateSystems\Matrix;
use PDF\Graphics\GraphicsState\LineCapStyle;
use PDF\Graphics\GraphicsState\LineDashPattern;
use PDF\Syntax\ContentStreamsResources\ContentStreams;
use PDF\Syntax\ContentStreamsResources\Operators\AppendRectangle;
use PDF\Syntax\ContentStreamsResources\Operators\BeginTextObject;
use PDF\Syntax\ContentStreamsResources\Operators\ConcatenateMatrix;
use PDF\Syntax\ContentStreamsResources\Operators\CurveTo;
use PDF\Syntax\ContentStreamsResources\Operators\EndTextObject;
use PDF\Syntax\ContentStreamsResources\Operators\FillAndStrokePathNonzero;
use PDF\Syntax\ContentStreamsResources\Operators\FillPathNonzero;
use PDF\Syntax\ContentStreamsResources\Operators\LineTo;
use PDF\Syntax\ContentStreamsResources\Operators\MoveTextPosition;
use PDF\Syntax\ContentStreamsResources\Operators\MoveTo;
use PDF\Syntax\ContentStreamsResources\Operators\RestoreGraphicsState;
use PDF\Syntax\ContentStreamsResources\Operators\SaveGraphicsState;
use PDF\Syntax\ContentStreamsResources\Operators\SetLineCapStyle;
use PDF\Syntax\ContentStreamsResources\Operators\SetLineDashPattern;
use PDF\Syntax\ContentStreamsResources\Operators\SetLineWidth;
use PDF\Syntax\ContentStreamsResources\Operators\SetNonstrokingRGBColor;
use PDF\Syntax\ContentStreamsResources\Operators\SetStrokingRGBColor;
use PDF\Syntax\ContentStreamsResources\Operators\SetTextFontAndSize;
use PDF\Syntax\ContentStreamsResources\Operators\ShowText;
use PDF\Syntax\ContentStreamsResources\Operators\StrokePath;
use PDF\Syntax\DataStructure\Rectangle;
use PDF\Syntax\DataStructure\TextString;
use PDF\Syntax\DocumentStructure\DocumentCatalog;
use PDF\Syntax\DocumentStructure\PageTree\PageObject;
use PDF\Syntax\DocumentStructure\PageTree\PageTreeNode;
use PDF\Syntax\FileStructure\FileBody;
use PDF\Syntax\FileStructure\FileHeader;
use PDF\Syntax\Object\ArrayType;
use PDF\Syntax\Object\DictionaryObject\Entry;
use PDF\Syntax\Object\DictionaryType;
use PDF\Syntax\Object\IndirectReference;
use PDF\Syntax\Object\NameType;
use PDF\Syntax\Object\NumericType;
use PDF\Syntax\Object\StreamObject;
use PDF\Syntax\Object\StringObject\LiteralString;

require dirname(__DIR__) . '/vendor/autoload.php';

$helvetica = new Type1Font(StandardFont::Helvetica);
$resources = new ResourceDictionary(
    new Font(new DictionaryType(
        new Entry(new NameType('F1'), new IndirectReference($helvetica)),
    )),
);

// 1. Drawing uses paper coordinates: origin at the lower left,
// one user-space unit is 1/72 inch here.
$contents = new ContentStreams(
    new BeginTextObject(),
    new SetTextFontAndSize(new NameType('F1'), new NumericType(24)),
    new MoveTextPosition(new NumericType(54), new NumericType(778)),
    new ShowText(new LiteralString('Traces, couleurs et matrices')),
    new EndTextObject(),
    new BeginTextObject(),
    new SetTextFontAndSize(new NameType('F1'), new NumericType(11)),
    new MoveTextPosition(new NumericType(54), new NumericType(750)),
    new ShowText(new LiteralString('Chaque forme est une suite d\'operateurs PDF explicites.')),
    new EndTextObject(),

    // 2. q saves the state, rg selects the fill color.
    // re constructs the rectangle; f fills it and ends the path.
    new SaveGraphicsState(),
    new SetNonstrokingRGBColor(new NumericType(0.12), new NumericType(0.36), new NumericType(0.64)),
    new AppendRectangle(new NumericType(54), new NumericType(546), new NumericType(220), new NumericType(134)),
    new FillPathNonzero(),
    new RestoreGraphicsState(),

    // RG and w set the outline. Its color is independent of the fill.
    new SaveGraphicsState(),
    new SetStrokingRGBColor(new NumericType(0.12), new NumericType(0.36), new NumericType(0.64)),
    new SetLineWidth(new NumericType(3)),
    new AppendRectangle(new NumericType(321), new NumericType(546), new NumericType(220), new NumericType(134)),
    new StrokePath(),
    new RestoreGraphicsState(),
    new BeginTextObject(),
    new SetTextFontAndSize(new NameType('F1'), new NumericType(11)),
    new MoveTextPosition(new NumericType(54), new NumericType(524)),
    new ShowText(new LiteralString('re + f : remplir')),
    new EndTextObject(),
    new BeginTextObject(),
    new SetTextFontAndSize(new NameType('F1'), new NumericType(11)),
    new MoveTextPosition(new NumericType(321), new NumericType(524)),
    new ShowText(new LiteralString('re + S : tracer le contour')),
    new EndTextObject(),

    // 3. The Bézier curve begins at m and uses two control points.
    // Settings precede the path; S ends it before the matching Q.
    new SaveGraphicsState(),
    new SetStrokingRGBColor(new NumericType(0.82), new NumericType(0.34), new NumericType(0.12)),
    new SetLineWidth(new NumericType(5)),
    new SetLineCapStyle(LineCapStyle::Round),
    new MoveTo(new NumericType(54), new NumericType(410)),
    new CurveTo(
        new NumericType(175),
        new NumericType(500),
        new NumericType(405),
        new NumericType(320),
        new NumericType(541),
        new NumericType(410),
    ),
    new StrokePath(),
    new RestoreGraphicsState(),

    // The dashed line shows the curve's chord using a separate state.
    new SaveGraphicsState(),
    new SetStrokingRGBColor(new NumericType(0.58), new NumericType(0.62), new NumericType(0.67)),
    new SetLineWidth(new NumericType(1)),
    new SetLineDashPattern(new LineDashPattern(
        new ArrayType(new NumericType(4), new NumericType(4)),
        new NumericType(0),
    )),
    new MoveTo(new NumericType(54), new NumericType(410)),
    new LineTo(new NumericType(541), new NumericType(410)),
    new StrokePath(),
    new RestoreGraphicsState(),
    new BeginTextObject(),
    new SetTextFontAndSize(new NameType('F1'), new NumericType(11)),
    new MoveTextPosition(new NumericType(54), new NumericType(356)),
    new ShowText(new LiteralString('m + c + S : courbe ; m + l + S : segment pointille')),
    new EndTextObject(),

    // 4. cm concatenates [a b c d e f] with the current transformation matrix.
    // [1 0 0 1 130 205] translates the origin to (130, 205).
    new SaveGraphicsState(),
    new ConcatenateMatrix(new Matrix(
        new NumericType(1),
        new NumericType(0),
        new NumericType(0),
        new NumericType(1),
        new NumericType(130),
        new NumericType(205),
    )),
    new SetNonstrokingRGBColor(new NumericType(0.87), new NumericType(0.93), new NumericType(0.98)),
    new SetStrokingRGBColor(new NumericType(0.12), new NumericType(0.36), new NumericType(0.64)),
    new SetLineWidth(new NumericType(2)),
    new AppendRectangle(new NumericType(-50), new NumericType(-40), new NumericType(100), new NumericType(80)),
    new FillAndStrokePathNonzero(),
    new RestoreGraphicsState(),

    // cos(30°) ≈ 0.8660254 and sin(30°) = 0.5: rotation, then translation.
    // The same local rectangle is drawn in a second coordinate system.
    new SaveGraphicsState(),
    new ConcatenateMatrix(new Matrix(
        new NumericType(0.8660254),
        new NumericType(0.5),
        new NumericType(-0.5),
        new NumericType(0.8660254),
        new NumericType(415),
        new NumericType(205),
    )),
    new SetNonstrokingRGBColor(new NumericType(0.87), new NumericType(0.93), new NumericType(0.98)),
    new SetStrokingRGBColor(new NumericType(0.12), new NumericType(0.36), new NumericType(0.64)),
    new SetLineWidth(new NumericType(2)),
    new AppendRectangle(new NumericType(-50), new NumericType(-40), new NumericType(100), new NumericType(80)),
    new FillAndStrokePathNonzero(),
    new RestoreGraphicsState(),

    // Q restored matrix and colors: these labels are horizontal, black
    // and once again expressed in page coordinates.
    new BeginTextObject(),
    new SetTextFontAndSize(new NameType('F1'), new NumericType(11)),
    new MoveTextPosition(new NumericType(54), new NumericType(117)),
    new ShowText(new LiteralString('cm : translation')),
    new EndTextObject(),
    new BeginTextObject(),
    new SetTextFontAndSize(new NameType('F1'), new NumericType(11)),
    new MoveTextPosition(new NumericType(321), new NumericType(117)),
    new ShowText(new LiteralString('cm : rotation de 30 degres')),
    new EndTextObject(),
);

// 5. The document graph and writing follow the first tutorial.
$page = new PageObject(
    new Rectangle(new NumericType(0), new NumericType(0), new NumericType(595.28), new NumericType(841.89)),
    $resources,
    new StreamObject($contents),
);
$pages = (new PageTreeNode())->addKid($page);
$catalog = new DocumentCatalog($pages);
$information = new DocumentInformation(new Title(new TextString('Tracés, couleurs et transformations')));
$file = new FileStructure(
    new FileHeader('1.7'),
    new FileBody($catalog),
    new IndirectReference($catalog),
    new DictionaryType(new Entry(new NameType('Info'), new IndirectReference($information))),
);
$path = $argv[1] ?? __DIR__ . '/graphics.pdf';
$file->writeTo($path);
echo $path . PHP_EOL;